

Demographic Features of Indian Population
Human resources serve as both the ‘means’ and ‘end’ of economic activities, rendering them a crucial element of economic development. On one hand, a country’s population can significantly contribute to its economic growth; however, on the other hand, it can impede progress if not managed effectively. Regrettably, India’s population has emerged as a significant barrier to successful economic development and rapid progress. Prior to delving into the issue of India’s population, it would be advantageous to examine the Theory of Demographic Transition.
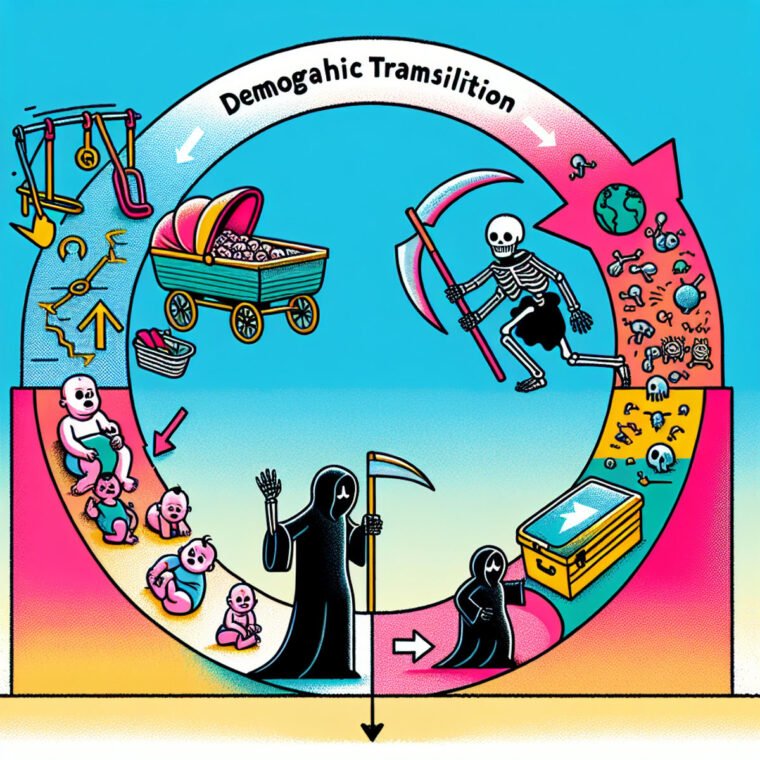
Theory of Demographic Transition
The theory of demographic change elucidates the correlation between population growth and fluctuations in birth and death rates, influenced by economic development. Birth and death rates vary across different stages of economic advancement, consequently affecting population growth rates. In underdeveloped economies, both birth and death rates are typically high, resulting in a low population growth rate.
Birth rate refers to the number of births per 1,000 individuals annually, while mortality rate indicates the number of deaths per 1,000 people. Initially, during economic development, improved living standards, access to healthcare, and better overall health conditions contribute to a decrease in the death rate, while the birth rate remains high, leading to a significant increase in the population growth rate. As economic development progresses further, factors such as higher living standards and increased education lead to a decline in the birth rate, resulting in a decrease in the population growth rate, potentially reaching zero over time.
Read More: New Monetary Policy of RBI
The various stages of demographic change are as follows
- First Stage or Stage of High Birth Rate and High Death Rate: In this initial stage, characterized by low economic development, both birth and death rates are high, resulting in minimal population growth. Factors such as low per capita income, inadequate healthcare facilities, and poor living conditions contribute to high mortality rates. Additionally, social and economic factors, such as the prevalence of joint family systems, encourage higher birth rates.
- Second Stage or Stage of Population Explosion due to High Birth Rate and Low Death Rate: In this stage, economic development progresses, leading to a decline in the death rate while the birth rate remains high, resulting in significant population growth. This phase of imbalance is unsustainable in the long run and necessitates further economic development to stabilize population growth.
- Third Stage or Stage of Declining Birth Rate and Low Death Rate: Economic development brings about structural changes, such as increased industrialization and urbanization, leading to a decline in both birth and death rates. Factors such as improved education, mobility, and changing attitudes towards family size contribute to the decrease in population growth.
- Fourth Stage or Stage of Low Birth Rate and Low Death Rate: At this stage, characterized by advanced economic development, both birth and death rates are low, resulting in a stable population. Factors such as high living standards, urbanization, and education contribute to this stability.
- Fifth Stage or Stage of Decline in Population: In this final stage, population decline occurs as birth and death rates continue to decrease. Some countries, like Poland, Romania, and Russia, are experiencing this decline in population.
These stages exemplify the intricate relationship between economic development and demographic shifts, impacting population growth rates worldwide.

Demographic Features of Indian Population
India ranks second in the world in terms of population and seventh in terms of area. It supports 18 percent of the global population with only 2.4 percent of the world’s land area and 2.5 percent of its income. This underscores the significant population density in India.
Read More: Problem of Poverty in India
1. Size and Growth of population in India
India exhibits both a high population size and growth rate. The population of India was 36.11 crore in 1951 and has been increasing rapidly ever since. This rapid population growth is often referred to as the ‘Population Explosion’. India’s population surged from 68.33 crore in 1981 to 102.90 crore in 2001 and further to 121.05 crore in 2011. The growth rate of India’s population remains notably high. Each year, approximately 1 crore 80 lakhs are added to our population. The population growth trend from 1891 to 2011, as depicted in the first census of India in 1891, illustrates this phenomenon.
| Year | Population (crore) | Population Growth (crore) |
|---|---|---|
| 1921 | 25.13 | 1.26 |
| 1951 | 36.11 | 4.24 |
| 1981 | 68.33 | 13.51 |
| 2001 | 102.9 | 18.27 |
| 2001 | 121.05 | 18.15 |
2. Classification of Growth of Population
The growth of India’s population is divided into four parts
- Period of Stable Population (1891 to 1921): Between 1891 and 1921, India witnessed a period of minimal population growth. Over these three decades, the population increment was a mere 1.26 crores. This sluggish growth can be linked to a variety of factors, including epidemics of famine, plague, cholera, and malaria. Particularly noteworthy is the devastating impact of the influenza epidemic of 1918, which resulted in the loss of 14 million lives.
- Period of Population Growth (1921 to 1951): Following 1921, India’s population began to increase at a rapid pace. This upward trend in population growth persisted until 1951. Consequently, 1921 is often referred to as a turning point in population dynamics. The population growth during this period surpassed that of the preceding thirty years.
- Period of Population Explosion (1951 to 1981): This era witnessed the most substantial increase in population, earning it the designation of the period of population explosion.
- High Population Growth with Signs of Slowdown: In this phase, while the birth rate has started to decline somewhat, the decrease in the death rate has counteracted any significant reduction in the overall population growth rate.
Read More: Main Features of Indian Economy
3. Birth Rate and Death Rate
The birth rate and death rate of the population in India are higher than those of many countries around the world. The birth rate is measured as the number of births per thousand persons in a year, while the death rate refers to the number of deaths per thousand persons in a year. Therefore, when it is stated that India’s birth rate is 20, it indicates that India sees the birth of 20 children per thousand people annually. The trends in birth rate and death rate in India over the last 120 years are illustrated in Table 2.
| Time | Birth Rate | Death Rate | Growth |
|---|---|---|---|
| 1901-1910 | 49.2 | 42.6 | 6.6 |
| 1921-1930 | 46.4 | 36.3 | 10.1 |
| 1951-1960 | 41.7 | 22.8 | 18.9 |
| 1981-1990 | 32.5 | 11.4 | 21.1 |
| 1991-2000 | 25.0 | 8.1 | 16.9 |
| 2001-2010 | 21.8 | 7.1 | 14.7 |
| 2020 | 19.5 | 6.0 | 13.5 |
4. Density of Population
Population density is defined as the average number of people living in one square kilometer. It is calculated by dividing the total population of a country by its total area. For instance, in 2011, India’s population was 121 crores, residing in an area of 32.80 lakh square kilometers. Hence, the population density of India was 382 per square kilometer.
5. Rural-Urban Population
The ratio of the urban population to the total population of a country serves as an indicator of its level of industrialization. As industrialization advances, the percentage of the urban population tends to increase. India maintains an agricultural index of 121, indicating a higher proportion of the rural population compared to the urban. Table 4 displays the ratio of rural and urban populations during various census periods in different years.
| Year | Rural Population | Urban Population |
|---|---|---|
| 1901 | 89.2 % | 10.8 % |
| 1951 | 82.7 % | 17.3 % |
| 1981 | 76.7 % | 23.3 % |
| 2001 | 72.2 % | 27.8 % |
| 2011 | 68.8 % | 31.2 % |
6. Age Structure / Age Composition
The age structure of a country’s population indicates the economic productivity potential of that nation. The working-age population, typically defined as individuals aged 15 to 64 years, is considered crucial for economic activity. By analyzing the population distribution across age groups, particularly focusing on the 0-14 years and above 60 years cohorts, one can gauge the economic viability of a country. The demographic composition, especially the proportion of the working-age population, plays a significant role in determining the economic strength of a nation.
Read More: Economic Policy Changes in India since 1991
| Year | Age Group (0 – 14) | Age Group (15 – 59) | Age Group 60 and over 60 years |
|---|---|---|---|
| 1911 | 38.8 | 60.2 | 1.0 |
| 1951 | 37.4 | 57.1 | 5.5 |
| 1981 | 39.5 | 54.0 | 6.5 |
| 2001 | 35.3 | 57.0 | 7.7 |
| 2011 | 30.9 | 60.5 | 8.6 |
| 2018 | 25.9 | 66.5 | 8.1 |
7. Life Expectancy
Life expectancy, which refers to the average lifespan of a country’s residents, used to be relatively short. However, with the implementation of various schemes and initiatives, life expectancy has increased significantly.
A.K. Dass Gupta suggests that in the process of economic development, the rate of population growth is not as much of a determining factor as the potential lifespan. With an increase in the average age, people are able to contribute more to production. Currently, India’s estimated lifespan is 69.7 years. In other countries around the world, the lifespan is much higher than in our country. It is 79 years in America, 85 years in Japan, 81 years in England, 83 years in Australia, 82 years in Sweden, 77 years in China, 77 years in Sri Lanka, and also 82 years in Canada. The global average life expectancy in 2019 was 73 years.
| Year | Life Expectancy (In years) | Year | Life Expectancy (In years) |
|---|---|---|---|
| 1951 | 33.0 | 1991 | 59.0 |
| 1961 | 41.0 | 2001 | 64.0 |
| 1971 | 52.0 | 2011 | 66.1 |
| 1981 | 54.0 | 2019 | 69.7 |
8. Sex Ratio
The female-to-male ratio, often referred to as the sex ratio, indicates the number of women per 1,000 men. Across most countries worldwide, this ratio stands at 984 women per thousand men, based on data from the 2011 census. This ratio plays a significant role in demographic analysis and social dynamics, reflecting various factors such as gender imbalances, cultural norms, and socio-economic disparities. Understanding the nuances of sex ratios can provide valuable insights into population trends, gender equality efforts, and policy formulation.
| Year | Number of Women per thousand Men | Year | Number of Women per thousand Men |
|---|---|---|---|
| 1901 | 972 | 1981 | 934 |
| 1951 | 946 | 1991 | 927 |
| 1961 | 941 | 2001 | 933 |
| 1971 | 930 | 2011 | 943 |
9. Literacy
According to the 2011 census, the literacy rate in India stands at 74.04%. This rate is 82.14% for men and 65.46% for women. An educated individual is defined as someone above 7 years of age who can read and write in any language. However, in today’s context, mere ability to read without the ability to write is not considered a complete education. It’s worth noting that formal education obtained through educational institutions or passing examinations is not the only means of acquiring knowledge. Individuals can also educate themselves through self-learning or non-formal education systems.
Kerala stands out with the highest literacy rate among all Indian states, reaching an impressive 93.9%. In contrast, Bihar lags behind with a literacy rate of 63.8%. Kerala also excels in promoting self-education, boasting a commendable rate of 92%. Rajasthan, however, grapples with the lowest literacy rate in the country, standing at 52.7%.
When considering female literacy rates, there are notable variations among states. Punjab reports a female literacy rate of 71.3%, while Haryana and Himachal Pradesh follow closely with rates of 66.8% and 76.6%, respectively. Nevertheless, there remains significant room for improvement, particularly in districts where the literacy rate still hovers as low as 56.2%.
Overall, there has been a notable increase in the percentage of educated population across all states and union territories in India during the ten-year period from 2001 to 2011.
Read More: How Economic Growth Has Damaged the Environment?
FAQ on Demographic Features of Indian Population
What is Theory of Demographic Transition?
The theory of demographic change elucidates the correlation between population growth and fluctuations in birth and death rates, influenced by economic development. Birth and death rates vary across different stages of economic advancement, consequently affecting population growth rates. In underdeveloped economies, both birth and death rates are typically high, resulting in a low population growth rate.
What are the stages of demographic change?
1. First Stage or Stage of High Birth Rate and High Death Rate
2. Second Stage or Stage of Population Explosion due to High Birth Rate and Low Death Rate
3. Third Stage or Stage of Declining Birth Rate and Low Death Rate
4. Fourth Stage or Stage of Low Birth Rate and Low Death Rate
5. Fifth Stage or Stage of Decline in Population
What is Population Explosion?
Population explosion refers to a rapid and uncontrolled increase in the population size of a particular species, often resulting in overpopulation and straining available resources, infrastructure, and environmental sustainability.
What is the Birth Rate?
The birth rate, also known as the crude birth rate, is a demographic measure that quantifies the number of live births occurring in a specific population during a given period, usually expressed as the number of births per 1,000 individuals within that population per year.
What is the Death Rate?
The death rate, also known as the crude death rate, is a demographic indicator that measures the number of deaths occurring within a specific population during a given period, usually expressed as the number of deaths per 1,000 individuals within that population per year.
What is Population Density?
Population density refers to the measurement of the average number of individuals living within a unit area, typically expressed as the number of people per square kilometer or square mile. It provides an indication of how crowded or densely populated a particular area or region is.